This blog note how to create a figure and edit on a figure with TikZ.
Create a Figure with TikZ
TikZ just defines a number of TEX commands that draw graphics. In a sense, when you use TikZ you “program” your graphics, just as you “program” your document when you use TEX. This also explains the name: TikZ is a recursive accronym in the tradition of “gnu is not unix” and means “TikZ ist kein Zeichenprogramm,” which translates to “TikZ is not a drawing program,” cautioning the reader as to what to expect. With TikZ you get all the advantages of the “TEX-approach to typesetting” for your graphics: quick creation of simple graphics, precise positioning, the use of macros, often superior typography.
TikZ’s rerference The Tik Z and PGF Packages provides us a full explanation for TikZ and its “basic layer” - PGF (protable graphics format). Here we copy one of the representive example of this rerference (chapter 2).
% need add: \usetikzlibrary{intersections}
\begin{tikzpicture}[scale=3,line cap=round,
% Styles
axes/.style=,
important line/.style={very thick},
information text/.style={rounded corners,fill=red!10,inner sep=1ex}]
% Colors
\colorlet{anglecolor}{green!50!black}
\colorlet{sincolor}{red}
\colorlet{tancolor}{orange!80!black}
\colorlet{coscolor}{blue}
% The graphic
\draw[help lines,step=0.5cm] (-1.4,-1.4) grid (1.4,1.4);
\draw (0,0) circle [radius=1cm];
\begin{scope}[axes]
\draw[->] (-1.5,0) -- (1.5,0) node[right] {$x$} coordinate(x axis);
\draw[->] (0,-1.5) -- (0,1.5) node[above] {$y$} coordinate(y axis);
\foreach \x/\xtext in {-1, -.5/-\frac{1}{2}, 1}
\draw[xshift=\x cm] (0pt,1pt) -- (0pt,-1pt) node[below,fill=white] {$\xtext$};
\foreach \y/\ytext in {-1, -.5/-\frac{1}{2}, .5/\frac{1}{2}, 1}
\draw[yshift=\y cm] (1pt,0pt) -- (-1pt,0pt) node[left,fill=white] {$\ytext$};
\end{scope}
\filldraw[fill=green!20,draw=anglecolor] (0,0) -- (3mm,0pt) arc [start angle=0, end angle=30, radius=3mm];
\draw (15:2mm) node[anglecolor] {$\alpha$};
\draw[important line,sincolor] (30:1cm) -- node[left=1pt,fill=white] {$\sin \alpha$} (30:1cm |- x axis); \draw[important line,coscolor] (30:1cm |- x axis) -- node[below=2pt,fill=white] {$\cos \alpha$} (0,0);
\path [name path=upward line] (1,0) -- (1,1);
\path [name path=sloped line] (0,0) -- (30:1.5cm);
\draw [name intersections={of=upward line and sloped line, by=t}] [very thick,orange] (1,0) -- node [right=1pt,fill=white] {$\displaystyle \tan \alpha \color{black}=\frac{\color{red}\sin \alpha}{\color{blue}\cos \alpha}$} (t);
\draw (0,0) -- (t);
\draw[xshift=1.85cm] node[right,text width=6cm,information text]
{
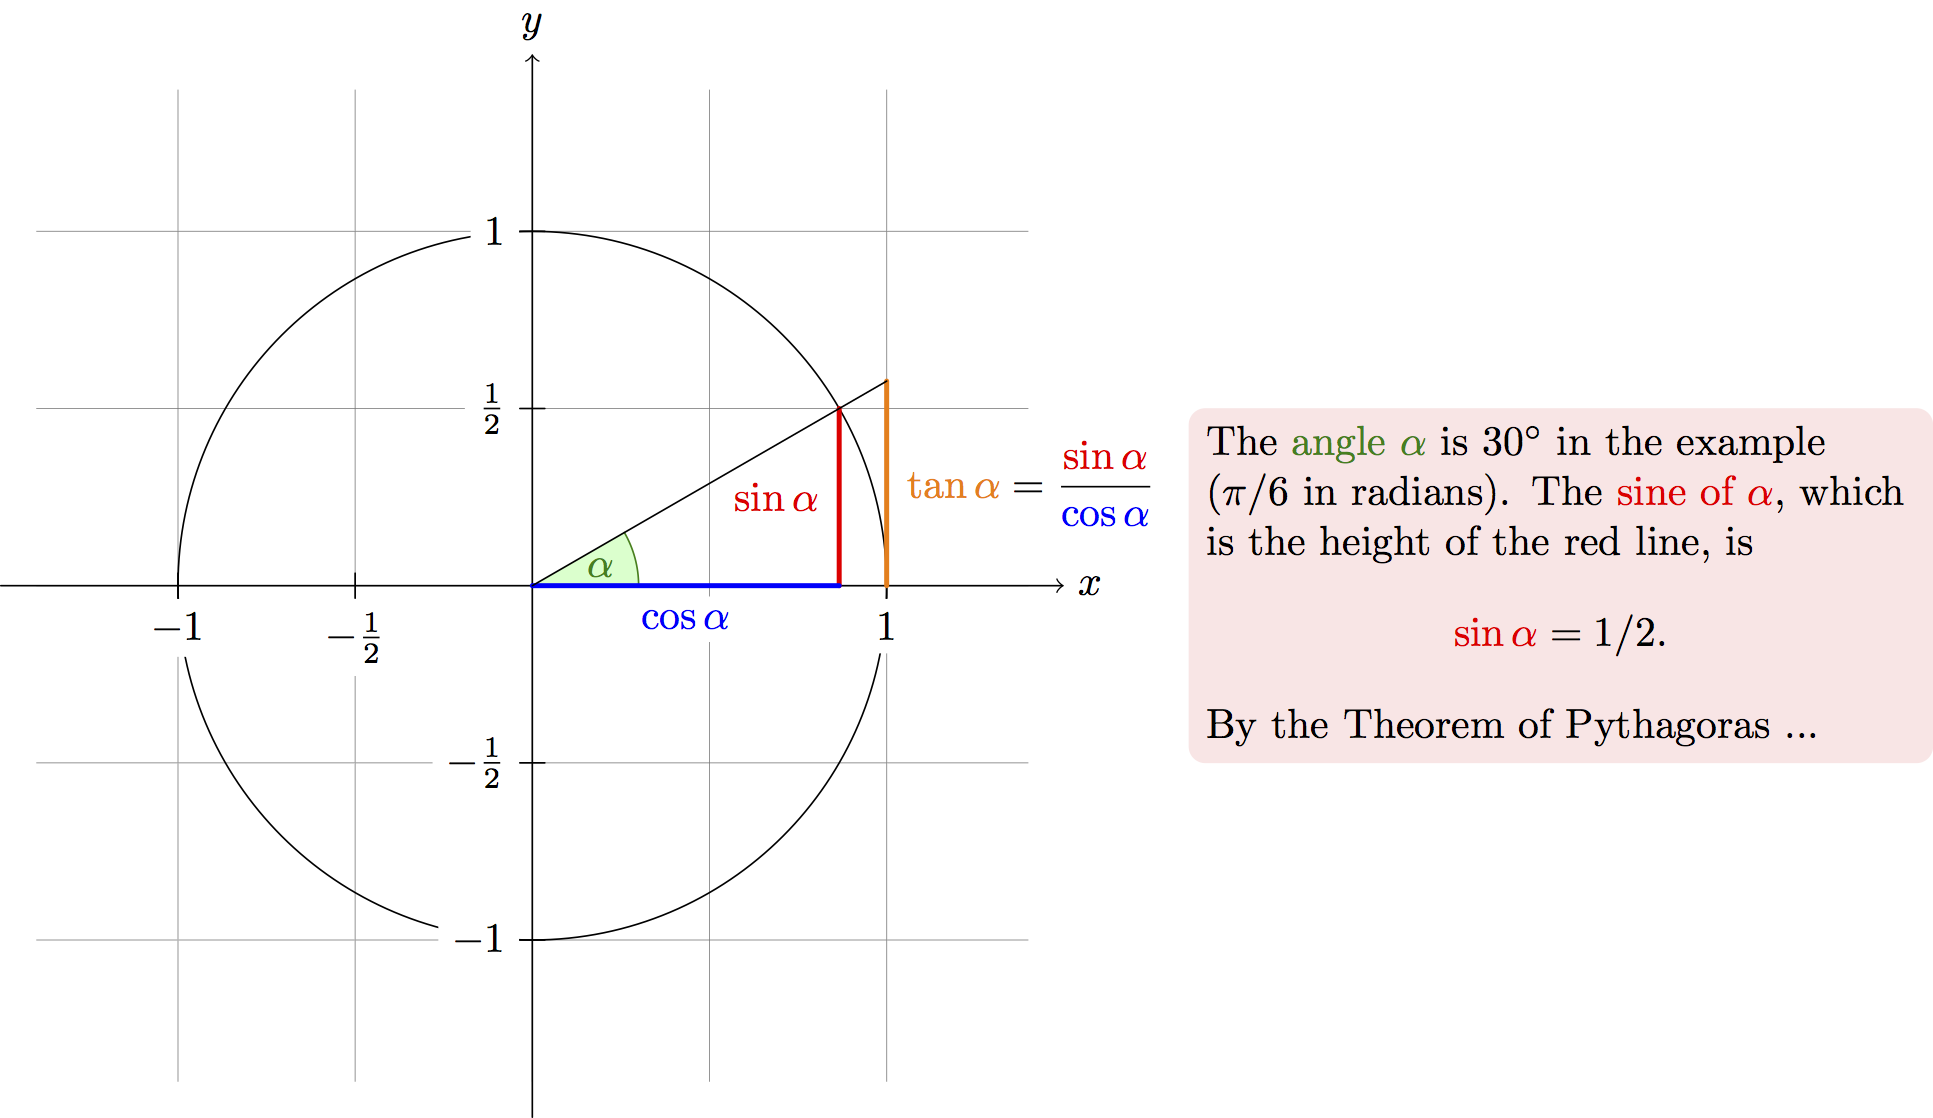
The {\color{anglecolor} angle $\alpha$} is $30^\circ$ in the
example ($\pi/6$ in radians). The {\color{sincolor}sine of
$\alpha$}, which is the height of the red line, is
\[
{\color{sincolor} \sin \alpha} = 1/2. \] By the Theorem of Pythagoras ...
};
\end{tikzpicture}
the above TikZ script gives us the following figure:
Edit a Figure with TIKZ
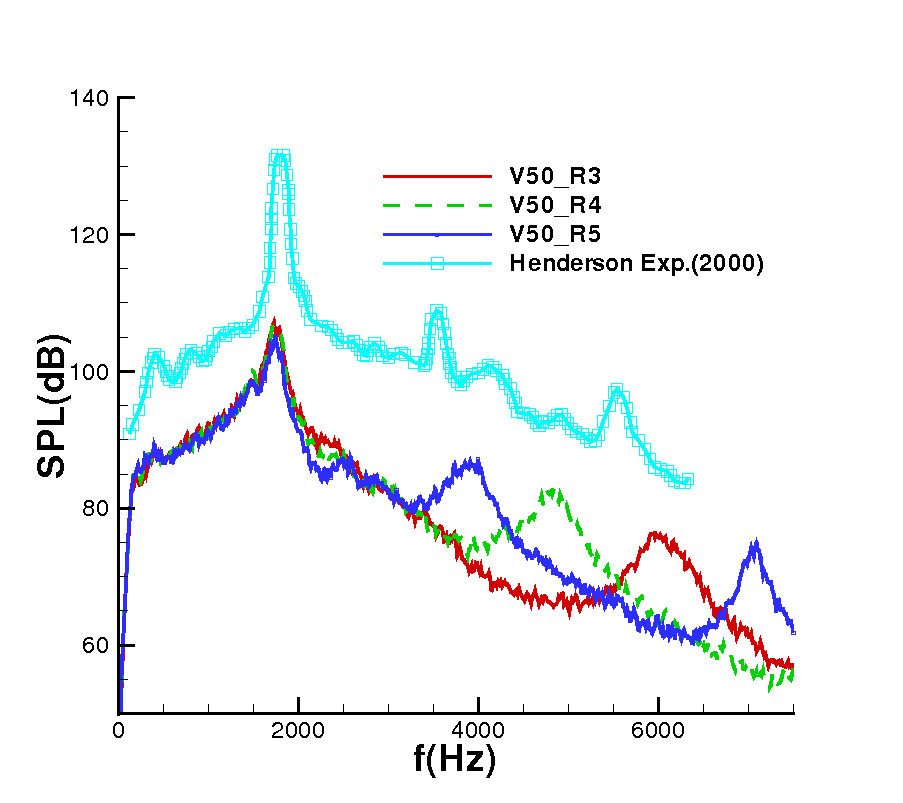
Suppose we have a figure as show below:
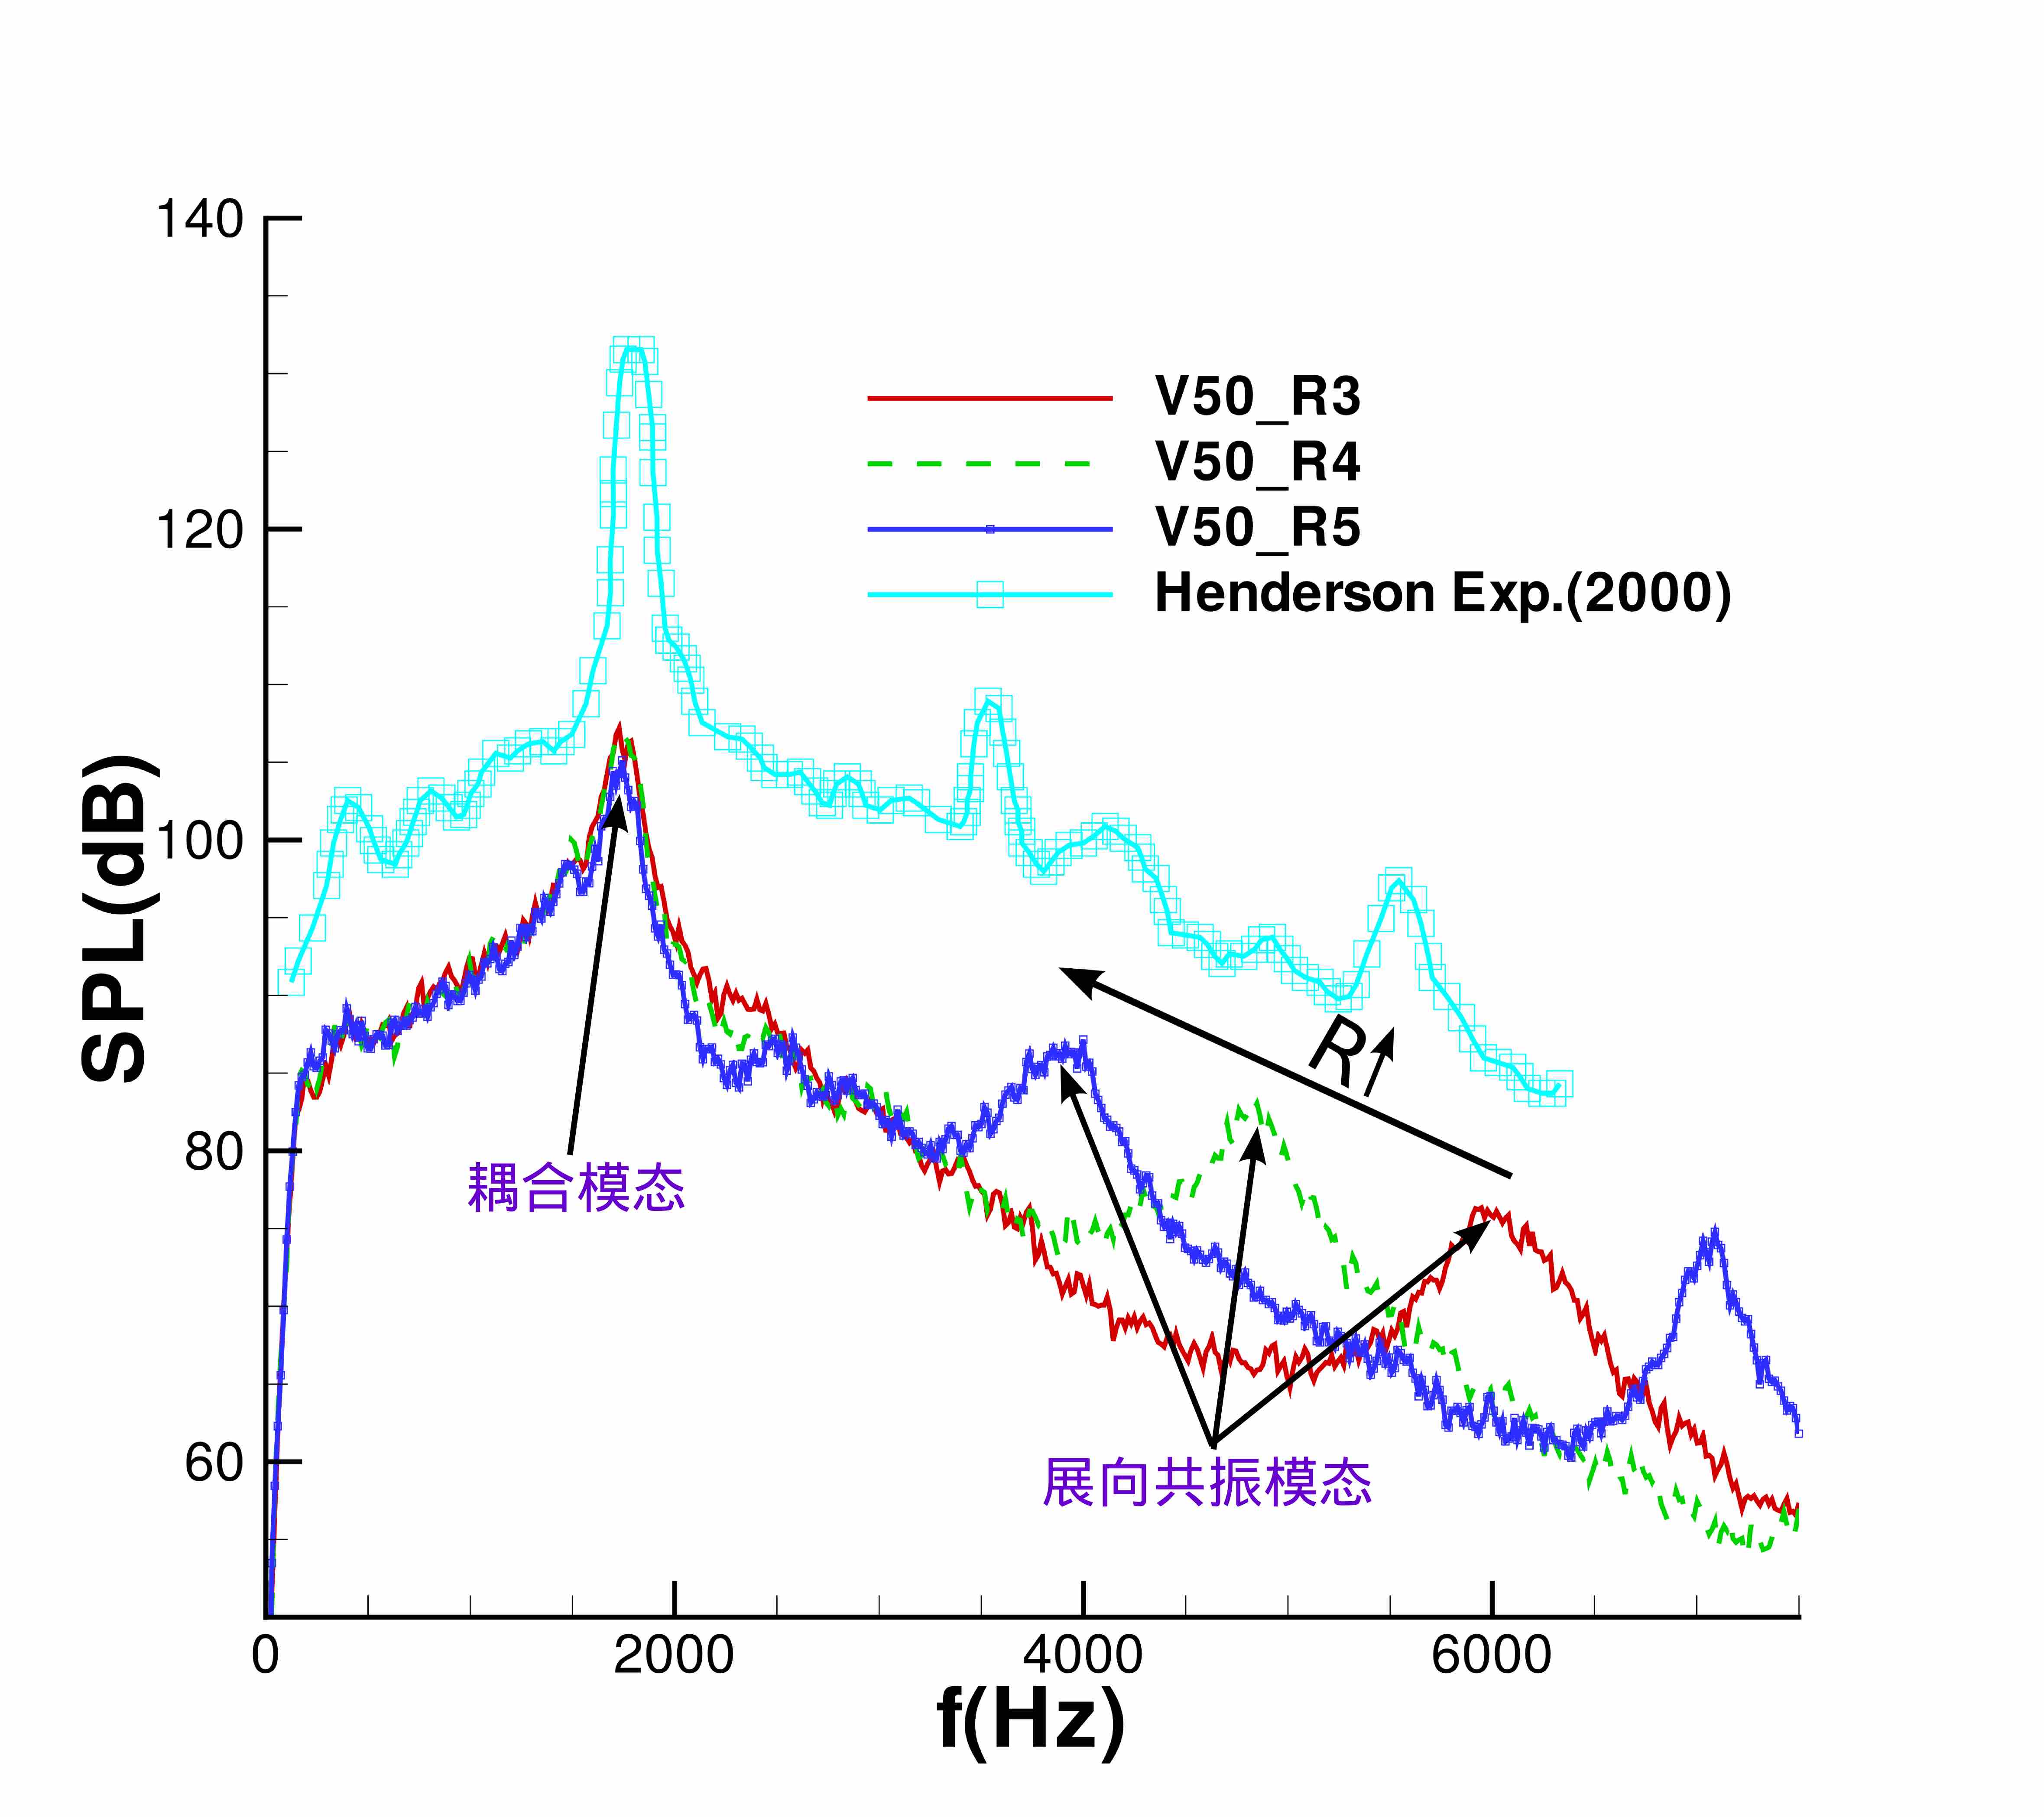
we want add some text, for example, on it. One common option is use photoshop like software, here is the post-result with inkscape
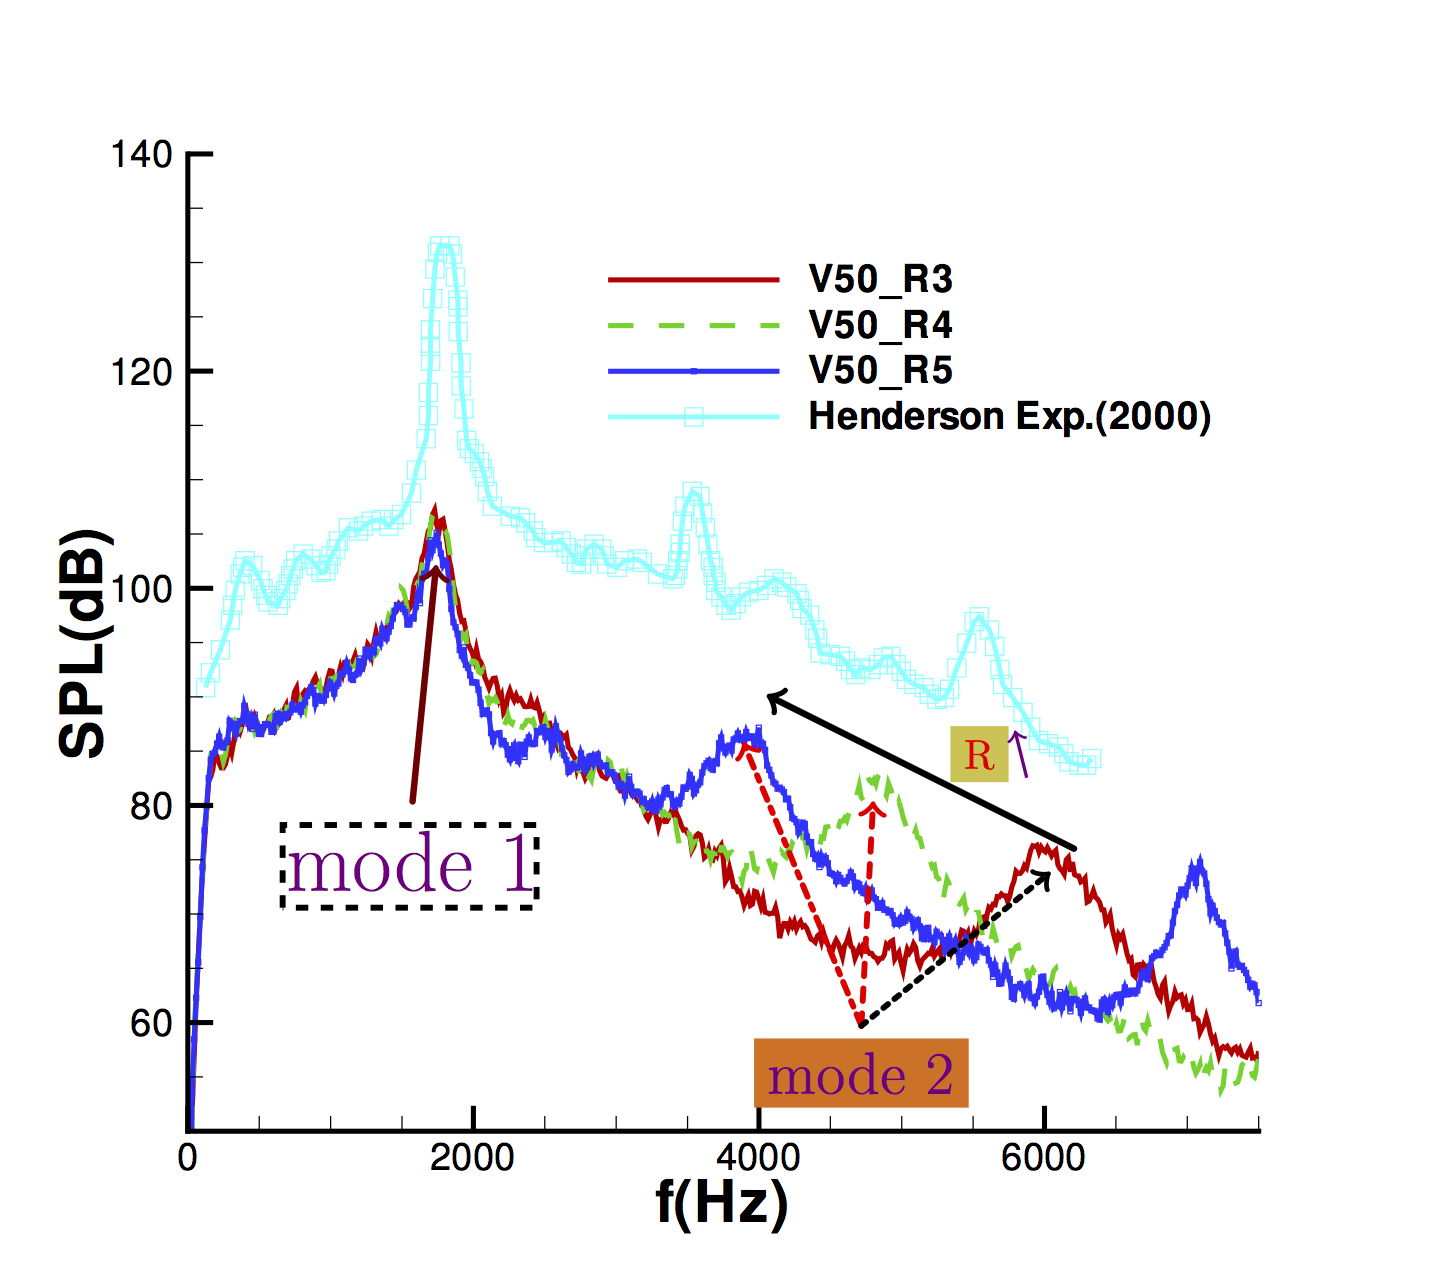
But if one use latex, a more direct way is use TikZ. For example, with the following latex class,
    \documentclass{standalone}
    \usepackage{tikz}
    % filename: TiKZforExternalFig.tex
    % To generate TiKZforExternalFig.pdf : pdflatex TiKZforExternalFig.tex
    \begin{document}
    \begin{tikzpicture}
      \node[anchor=south west,inner sep=0] at (0,0) {\includegraphics[width=\textwidth]{./fig/ExpComp.eps}};
        \draw[->,line width=0.55mm,line cap=round] (9.1,3.6) -- (6.5,4.9);
        \draw[red] (8.3,4.4) node [fill=yellow!80!black]{R};
        \draw[->,thick,violet] (8.7,4.2) -- (8.6,4.6);
        \draw[->, line width=0.55mm,line cap=round,black!50!red] (3.5,4.0) -- (3.7,6.0);
        \draw[line width=0.5mm, dashed] (2.4,3.1) rectangle (4.55,3.8);
        \draw[violet] (3.5,3.5) node {\huge mode 1};
        \draw[->,line width=0.5mm,line cap=round, red, dash dot] (7.3,2.1) -- (6.3,4.5);
        \draw[->,line width=0.5mm,line cap=round, red, dashed] (7.3,2.1) -- (7.4,4.0);
        \draw[->,line width=0.5mm,line cap=round, black, dotted] (7.3,2.1) -- (8.9,3.4);
        \draw[violet] (7.3,1.7) node [fill=blue!10!orange] {\Large mode 2};
    \end{tikzpicture}
    \end{document}
the initial figure becomes
And it can be directly loaded by your tex file, for example
    \documentclass{article}
    \usepackage[utf8]{inputenc}
    \usepackage{tikz}
    \usepackage{standalone}

    \begin{document}
    \begin{figure}[h]
      \centering
      \includestandalone[width=0.8\textwidth]{\path\to\tex\class\TiKZforExternalFig}    %without .tex extension
      \caption{Use TikZ for external figure}
      \label{TiKZforExternalFig}
    \end{figure}
    \end{document}
Combine with Multimedia
In combine with multimedia, one can also organise a video like with a figure. For example, with following script
    \documentclass{standalone}
    \usepackage{tikz}
    \usepackage{multimedia}
    % filename: video.tex
    % To generate video.pdf : pdflatex video.tex
    \begin{document}
    \begin{tikzpicture}
      \node[anchor=south west,inner sep=0] at (0,0) { \movie[autostart,label=video,width=8cm,height=6cm,showcontrols,loop,poster]{}{./fig/flagellum2.mp4}};
    \end{tikzpicture}
    \end{document}